Journals > > Topics > Imaging Systems
Imaging Systems|663 Article(s)
Static Volumetric 3D Display System Based on Scanning Galvanometer and Digital Micromirror Display Control
Dongcheng Han, Shizhi Yang, Qiang Zhao, Liangliang Zhang, and Yan Deng
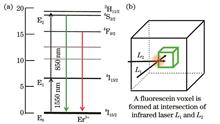
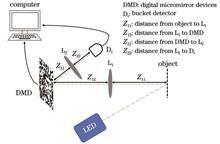
ObjectiveThe static volumetric 3D display technology displays 3D objects by volume pixels in 3D space, presenting real stereoscopic images. It can provide physiological and psychological depth clues for human visual systems to perceive 3D objects and can meet all-around observation needs. Additionally, it is the most likely 3D display technology to achieve high spatial resolution, multi-angle, and simultaneous observation of multiple people, real-time interaction, and large size. Among them, the static volume 3D display technology based on dual beam addressing has attracted much attention due to its unique advantages such as fine voxel, high spatial resolution, easy realization of full-color display, and meanwhile the image is no shaking and does not require auxiliary equipment (such as glasses) to view. By employing the energy of two infrared photons to pump a material into an excited energy level, the electrons in the excited energy level will transition to a lower energy level and produce visible light, which is an effective way to achieve dual-beam addressing. The material that can implement this luminescence process is also known as the two-step two-frequency (TSTF) up-conversion luminescence (UCL) material, and it can have great potential applications in static volumetric 3D display technology due to its rapid response, high contrast, and high color purity. Despite this, the material has received few reports in volumetric 3D display applications because of its low UCL efficiency and small display volume. Additionally, some literature focuses on the properties of materials, with less introduction of 3D display systems. The above two points greatly limit the application and research interest of the 3D volume display of TSTF UCL materials. Thus, we develop a 3D imaging system based on the TSTF UCL mechanism of rare earth ions, and meanwhile build a projection imaging optical path based on digital optical processing (DLP) and a line laser shaping optical path based on scanning galvanometer and cylindrical mirror. The display system is based on the TSTF UCL technology, which employs a dual infrared laser excitation, and adopts the digital micromirror display (DMD) and scanning galvanometer to achieve rapid scanning of image volume at high resolution. It has lower material performance requirements and cost, and more simple method than dual DLP imaging mode. This system is very suitable for the preliminary study of the stereoscopic display effect of TSTF UCL materials and also provides an effective idea for the imaging schemes of other addressing media materials. Additionally, the TSTF UCL material utilized for the display is a cyclohexane solution of core-shell NaYF4∶0.5%Er@NaGdF4∶2%Yb@NaYF4∶1%Er (NYF@NGF@NYF) nanocrystals, which has great potential for large-scale imaging.MethodsWe present a static volumetric 3D display system with wide wavelength and fast response, which includes three parts of display medium, control system, and laser system. In the experiment, nanocrystals NaYF4∶Er@NaGdF4∶Yb@NaYF4∶Er with dual-step dual-frequency up-conversion ability are selected as imaging medium. The control system employs 1024×768 DMD and scanning galvanometer to project the infrared laser. By the appropriate design of imaging optical software, the two-dimensional slice of the stereoscopic image is converted into the control signal of the DMD/scanning galvanometer. The laser system adopts 1550 nm and 850 nm infrared lasers as the addressing and imaging light source and adjusts the beam and optical path with appropriate parameters.Results and DiscussionsThe upconversion emission spectra of NYF@NGF@NYF are measured [Fig. 3(b)]. After integrating the emission spectrum in the visible range (500-700 nm), it can be concluded that contrast is I1550+850/(I1550+I850)=28.69, where I1550+I850, I1550, and I850 are the emission intensity under co-excitation of 1550 nm and 850 nm lasers, under excitation of 1550 nm laser, and under excitation of 850 nm laser respectively. With self-made display materials and the self-built static volumetric display system, a variety of 3D images can be demonstrated at a refresh rate of 40 Hz, and the images are clear and bright (Fig. 7). The maximum luminous power of a single point measured by the power meter can reach 0.5 mW, the theoretical maximum resolution can be 30×1024×768, and the number of voxels is close to 23 million.ConclusionsWe report a two-beam scanning 3D imaging system based on the dual-frequency upconversion luminescence mechanism of rare earth ions. The DLP and scanning galvanometer in the optical path are controlled by the computer to build a 3D dynamic model in the liquid medium. The images presented by the system feature stability, high resolution, fast scanning speed, and maximum voxels of 23 million, without observation angle limitations. The various parts of the system such as the light source, the light path, and the display medium are independent and can be quickly replaced and flexibly adjusted to adapt to the excitation properties of different materials. The material adopted for the display is a cyclohexane solution of the core-shell structure NYF@NGF@NYF nanocrystals, which has great potential for large-scale imaging. The system has certain reference significance for the development of volumetric 3D display and provides support for the preliminary research on 3D display capability of display media such as TSTF materials. Meanwhile, this display system is characterized by convenient building and obvious display effect, without the requirement for high material properties. It assists with the preliminary research on up-conversion materials in 3D display and serves as references for exploring large-size 3D volume display technology. ObjectiveThe static volumetric 3D display technology displays 3D objects by volume pixels in 3D space, presenting real stereoscopic images. It can provide physiological and psychological depth clues for human visual systems to perceive 3D objects and can meet all-around observation needs. Additionally, it is the most likely 3D display technology to achieve high spatial resolution, multi-angle, and simultaneous observation of multiple people, real-time interaction, and large size. Among them, the static volume 3D display technology based on dual beam addressing has attracted much attention due to its unique advantages such as fine voxel, high spatial resolution, easy realization of full-color display, and meanwhile the image is no shaking and does not require auxiliary equipment (such as glasses) to view. By employing the energy of two infrared photons to pump a material into an excited energy level, the electrons in the excited energy level will transition to a lower energy level and produce visible light, which is an effective way to achieve dual-beam addressing. The material that can implement this luminescence process is also known as the two-step two-frequency (TSTF) up-conversion luminescence (UCL) material, and it can have great potential applications in static volumetric 3D display technology due to its rapid response, high contrast, and high color purity. Despite this, the material has received few reports in volumetric 3D display applications because of its low UCL efficiency and small display volume. Additionally, some literature focuses on the properties of materials, with less introduction of 3D display systems. The above two points greatly limit the application and research interest of the 3D volume display of TSTF UCL materials. Thus, we develop a 3D imaging system based on the TSTF UCL mechanism of rare earth ions, and meanwhile build a projection imaging optical path based on digital optical processing (DLP) and a line laser shaping optical path based on scanning galvanometer and cylindrical mirror. The display system is based on the TSTF UCL technology, which employs a dual infrared laser excitation, and adopts the digital micromirror display (DMD) and scanning galvanometer to achieve rapid scanning of image volume at high resolution. It has lower material performance requirements and cost, and more simple method than dual DLP imaging mode. This system is very suitable for the preliminary study of the stereoscopic display effect of TSTF UCL materials and also provides an effective idea for the imaging schemes of other addressing media materials. Additionally, the TSTF UCL material utilized for the display is a cyclohexane solution of core-shell NaYF4∶0.5%Er@NaGdF4∶2%Yb@NaYF4∶1%Er (NYF@NGF@NYF) nanocrystals, which has great potential for large-scale imaging.MethodsWe present a static volumetric 3D display system with wide wavelength and fast response, which includes three parts of display medium, control system, and laser system. In the experiment, nanocrystals NaYF4∶Er@NaGdF4∶Yb@NaYF4∶Er with dual-step dual-frequency up-conversion ability are selected as imaging medium. The control system employs 1024×768 DMD and scanning galvanometer to project the infrared laser. By the appropriate design of imaging optical software, the two-dimensional slice of the stereoscopic image is converted into the control signal of the DMD/scanning galvanometer. The laser system adopts 1550 nm and 850 nm infrared lasers as the addressing and imaging light source and adjusts the beam and optical path with appropriate parameters.Results and DiscussionsThe upconversion emission spectra of NYF@NGF@NYF are measured [Fig. 3(b)]. After integrating the emission spectrum in the visible range (500-700 nm), it can be concluded that contrast is I1550+850/(I1550+I850)=28.69, where I1550+I850, I1550, and I850 are the emission intensity under co-excitation of 1550 nm and 850 nm lasers, under excitation of 1550 nm laser, and under excitation of 850 nm laser respectively. With self-made display materials and the self-built static volumetric display system, a variety of 3D images can be demonstrated at a refresh rate of 40 Hz, and the images are clear and bright (Fig. 7). The maximum luminous power of a single point measured by the power meter can reach 0.5 mW, the theoretical maximum resolution can be 30×1024×768, and the number of voxels is close to 23 million.ConclusionsWe report a two-beam scanning 3D imaging system based on the dual-frequency upconversion luminescence mechanism of rare earth ions. The DLP and scanning galvanometer in the optical path are controlled by the computer to build a 3D dynamic model in the liquid medium. The images presented by the system feature stability, high resolution, fast scanning speed, and maximum voxels of 23 million, without observation angle limitations. The various parts of the system such as the light source, the light path, and the display medium are independent and can be quickly replaced and flexibly adjusted to adapt to the excitation properties of different materials. The material adopted for the display is a cyclohexane solution of the core-shell structure NYF@NGF@NYF nanocrystals, which has great potential for large-scale imaging. The system has certain reference significance for the development of volumetric 3D display and provides support for the preliminary research on 3D display capability of display media such as TSTF materials. Meanwhile, this display system is characterized by convenient building and obvious display effect, without the requirement for high material properties. It assists with the preliminary research on up-conversion materials in 3D display and serves as references for exploring large-size 3D volume display technology.
Acta Optica Sinica
- Publication Date: Apr. 25, 2024
- Vol. 44, Issue 8, 0811002 (2024)

Orthogonal Multi-Material Decomposition for X-Ray CT and Application in Metal Artifact Correction
Ting Luo, Xing Zhao, Yunsong Zhao, and Tao Li
ObjectiveX-ray computed tomography (CT) imaging technology, with nondestructive testing capabilities, has been widely used in industry, medicine, and other fields. When X-ray CT imaging is performed on samples containing high-absorption materials such as metals, the reconstructed images often contain metal artifacts due to beam hardening, scattering, and other factors, which severely degrade the quality of CT imaging. More recently, dual/multi-spectral CT has been proposed as an effective means of reducing beam-hardening and metal artifacts. However, it needs multiple scans of the object or specialized multi-spectral CT equipment. In this paper, we studied the multi-material decomposition reconstruction technique with traditional CT scanned data to reduce beam-hardening and metal artifacts.MethodsThe problem of multi-material decomposition reconstruction in traditional single-spectral CT is inherently highly underdetermined, leading to non-unique solutions. To obtain physically meaningful true solutions, it is necessary to incorporate additional constraints. In a type of scenario, the constituent materials of the scanned object are known and immiscible. The reconstructed image vectors are orthogonal if these materials are selected as basis materials needed in multi-material decomposition reconstruction. Based on this finding, an orthogonal multi-material decomposition reconstruction technique (OMDRT) combined with the X-ray energy spectrum was proposed. In the proposed OMDRT method, the order of basis materials was sorted based on the decreasing sequence of their attenuation coefficients. With triple-material decomposition reconstruction as an example, the proposed OMDRT method includes steps as follows: 1) triple-material decomposition reconstruction; 2) generation of the first material’ mark images from reconstructed image; 3) triple-material decomposition reconstruction with the first material’ mark images; 4) generation of the first and second materials’ mark images from reconstructed images; 5) triple-material decomposition reconstruction with the first and second materials’ mark images. Steps 4) and 5) were performed iteratively. In steps 3) and 5), the weights for the decomposition reconstruction of basis materials from the projection data were adjusted based on the materials’ regional location marked in the materials’ mark images。Results and DiscussionsThe numerical phantom used in the simulation is shown in Fig. 2(c), and it includes three materials: water, bone (simulating the teeth), and AgHg (simulating the dental filling) with standard densities of 1 g/cm3, 1.92 g/cm3, and 12 g/cm3, respectively. If the mass attenuation coefficients of these three materials are used as basis functions, the density of the material region in the corresponding image is the standard density. We select AgHg as the first basis material, bone as the second basis material, and water as the third basis material. By using the simulated projections of phantom without and with noise, density images are reconstructed with the proposed OMDRT. From the last rows in Fig. 4 and Fig. 11, we can see that the three materials are mostly separated in the results of three iterations, and metal artifacts have been effectively corrected basically. Figure 8 and figure 13 show that there are no obvious artifacts in either the density images or the virtual monochromatic image. To quantitatively analyze the image quality, we calculate the peak signal-to-noise ratio (PSNR) and normalized mean absolute deviation (NMAD) between the resulting virtual monochromatic images and the actual virtual monochromatic images. From Fig. 7 and Fig. 12, we can observe that the proposed OMDRT method converges within several iterations. In summary, the experimental results show that the method proposed in this paper has a good application effect in reducing metal artifacts.ConclusionsFor the metal artifact correction in CT images of scanned objects with known and non-mixing materials, we propose an iterative OMDRT of traditional CT. The proposed method chooses known materials as the basis materials, adjusting the weights for the decomposition reconstruction of basis materials based on their regional location. We choose a dental phantom with dental fillings to verify the validity of the proposed method. The basis materials are separated correctly with our method for both simulated noise-free data and Poisson noise data. In addition, artifacts caused by metal implants in both the triple-basis density images and the virtual monochromatic images combined by them are reduced effectively. Moreover, the proposed method converges within a small number of iterations, facilitating its widespread practical application. We verify the multi-material decomposition reconstruction technique of traditional CT. The experimental part does not utilize actual data and does not consider the effect of scattered photons, which are issues that require further research. During the experimental process, it is found that the accuracy of the spectrum significantly affects the effectiveness of the proposed method. How to acquire spectrum quickly and accurately is also a challenge that needs to be addressed in practical experiments. Future work will cover the OMDRT of dual/multi-spectral CT and explore its effectiveness in other applications. ObjectiveX-ray computed tomography (CT) imaging technology, with nondestructive testing capabilities, has been widely used in industry, medicine, and other fields. When X-ray CT imaging is performed on samples containing high-absorption materials such as metals, the reconstructed images often contain metal artifacts due to beam hardening, scattering, and other factors, which severely degrade the quality of CT imaging. More recently, dual/multi-spectral CT has been proposed as an effective means of reducing beam-hardening and metal artifacts. However, it needs multiple scans of the object or specialized multi-spectral CT equipment. In this paper, we studied the multi-material decomposition reconstruction technique with traditional CT scanned data to reduce beam-hardening and metal artifacts.MethodsThe problem of multi-material decomposition reconstruction in traditional single-spectral CT is inherently highly underdetermined, leading to non-unique solutions. To obtain physically meaningful true solutions, it is necessary to incorporate additional constraints. In a type of scenario, the constituent materials of the scanned object are known and immiscible. The reconstructed image vectors are orthogonal if these materials are selected as basis materials needed in multi-material decomposition reconstruction. Based on this finding, an orthogonal multi-material decomposition reconstruction technique (OMDRT) combined with the X-ray energy spectrum was proposed. In the proposed OMDRT method, the order of basis materials was sorted based on the decreasing sequence of their attenuation coefficients. With triple-material decomposition reconstruction as an example, the proposed OMDRT method includes steps as follows: 1) triple-material decomposition reconstruction; 2) generation of the first material’ mark images from reconstructed image; 3) triple-material decomposition reconstruction with the first material’ mark images; 4) generation of the first and second materials’ mark images from reconstructed images; 5) triple-material decomposition reconstruction with the first and second materials’ mark images. Steps 4) and 5) were performed iteratively. In steps 3) and 5), the weights for the decomposition reconstruction of basis materials from the projection data were adjusted based on the materials’ regional location marked in the materials’ mark images。Results and DiscussionsThe numerical phantom used in the simulation is shown in Fig. 2(c), and it includes three materials: water, bone (simulating the teeth), and AgHg (simulating the dental filling) with standard densities of 1 g/cm3, 1.92 g/cm3, and 12 g/cm3, respectively. If the mass attenuation coefficients of these three materials are used as basis functions, the density of the material region in the corresponding image is the standard density. We select AgHg as the first basis material, bone as the second basis material, and water as the third basis material. By using the simulated projections of phantom without and with noise, density images are reconstructed with the proposed OMDRT. From the last rows in Fig. 4 and Fig. 11, we can see that the three materials are mostly separated in the results of three iterations, and metal artifacts have been effectively corrected basically. Figure 8 and figure 13 show that there are no obvious artifacts in either the density images or the virtual monochromatic image. To quantitatively analyze the image quality, we calculate the peak signal-to-noise ratio (PSNR) and normalized mean absolute deviation (NMAD) between the resulting virtual monochromatic images and the actual virtual monochromatic images. From Fig. 7 and Fig. 12, we can observe that the proposed OMDRT method converges within several iterations. In summary, the experimental results show that the method proposed in this paper has a good application effect in reducing metal artifacts.ConclusionsFor the metal artifact correction in CT images of scanned objects with known and non-mixing materials, we propose an iterative OMDRT of traditional CT. The proposed method chooses known materials as the basis materials, adjusting the weights for the decomposition reconstruction of basis materials based on their regional location. We choose a dental phantom with dental fillings to verify the validity of the proposed method. The basis materials are separated correctly with our method for both simulated noise-free data and Poisson noise data. In addition, artifacts caused by metal implants in both the triple-basis density images and the virtual monochromatic images combined by them are reduced effectively. Moreover, the proposed method converges within a small number of iterations, facilitating its widespread practical application. We verify the multi-material decomposition reconstruction technique of traditional CT. The experimental part does not utilize actual data and does not consider the effect of scattered photons, which are issues that require further research. During the experimental process, it is found that the accuracy of the spectrum significantly affects the effectiveness of the proposed method. How to acquire spectrum quickly and accurately is also a challenge that needs to be addressed in practical experiments. Future work will cover the OMDRT of dual/multi-spectral CT and explore its effectiveness in other applications.
Acta Optica Sinica
- Publication Date: Apr. 25, 2024
- Vol. 44, Issue 8, 0811001 (2024)
High-Quality Image Reconstruction Characteristic Function for Single-Pixel Compressive Imaging
Shichang Ju, Junjie Cai, and Wenlin Gong
ObjectiveThe property of the measurement matrix has a great influence on the image reconstruction quality of single-pixel compressive imaging. Optimizing the measurement matrices is a core and crucial technology for single-pixel imaging. However, current optimization methods for measurement matrices often face the problems of local optimization and limited applicability. Additionally, existing analytical theories and methods based on the measurement matrix often fail to explain or predict the image reconstruction quality in many scenarios, and the quantitative relationship among measurement matrix characteristics, target properties, and image reconstruction results is unclear. For example, the reconstruction results vary obviously among different kinds of Hadamard encoding measurement matrices. Therefore, after combining optical imaging systems with compressive sensing theory, it has become an urgent issue for single-pixel compressive imaging to construct a characteristic function that can predict image reconstruction quality. We propose a characteristic function of high-quality image reconstruction for single-pixel compressive imaging to predict the imaging quality of targets with different sparsity, which is helpful for the optimal design of measurement matrices in single-pixel imaging systems.MethodsUnder the same sampling rate, the image reconstruction quality is significantly different for various kinds of Hadamard encoding measurement matrices, which can not be explained by existing compressive sensing theories. By combining compressive sensing theory with the characteristic parameters described in Ref. [23], the Gram matrix is obtained from the measurement matrix and then the relationship between the Gram matrix and the system's point spread function is clarified. Next, according to the point spread function and compressive sensing theory, four characteristic parameters are proposed, including the peak value of the strongest sidelobe, overlapped sidelobe peak value, spatial distance, and spectral cosine similarity. Based on these parameters, an image reconstruction characteristic function F(η) adopted for high-quality single-pixel compressive imaging is constructed. Meanwhile, by calculating the F(η) values of the random Hadamard encoding matrix in different sampling rates η and conducting data fitting, the relationship between the target's sparsity and the characteristic function is established. Furthermore, by changing the target's sparsity, sampling rate, and the type of encoding measurement matrices, the validity of the proposed characteristic function is verified by numerical simulations and experiments.Results and DiscussionsTo demonstrate the validity of the proposed characteristic function, we conduct both numerical simulations and experiments based on the scheme in Fig. 1. Firstly, when the sampling rate η=0.6 is fixed, the sparsity thresholds for Natural, CC, RD, Random, and MP Hadamard encoding matrices are obtained and random grayscale point targets can be stably reconstructed at their respective sparsity thresholds Sε [Fig. 7(a)]. However, the sparsity threshold Sε for the Random Hadamard encoding matrix is much larger than that of the other four Hadamard encoding matrices. What's more, under S>Sε, Natural, CC, RD, and MP Hadamard encoding matrices can not recover the image of the slit shaped target [Figs. 7(b) and 7(c)]. Secondly, according to Fig. 6, under Sε=0.25000, the corresponding sampling rates η for the five kinds of Hadamard encoding matrices above are 0.89100, 0.88600, 0.86600, 0.72800, and 0.89100 respectively. Numerical simulations and experimental results demonstrate that random grayscale point targets can be perfectly reconstructed by all the five kinds of Hadamard encoding matrices when the target's sparsity S=0.25000 (Fig. 8). Additionally, when the sampling rate is η=0.728, only the random sequence Hadamard encoding matrix can accurately restore the radial target with the sparsity S=0.25000. Finally, the universality of the proposed characteristic function is further verified by Bernoulli random encoding matrices, Gaussian random encoding matrices, and Gaussian orthogonal encoding matrices in different representation bases (Tables 2 and 3, and Fig. 9). Meanwhile, Fig. 9 demonstrates that the relationship described by Equation (8) is valid for other common random encoding matrices, which means that the characteristic function can be employed as the objective function in optimizing measurement matrices for single-pixel compressive imaging systems.ConclusionsCombined with the compressed sensing theory, four characteristic parameters based on the point spread function are proposed, including the peak value of the strongest sidelobe, overlapped sidelobe peak value, spatial distance, and spectral cosine similarity. A high-quality image reconstruction characteristic function of single-pixel compressive imaging is constructed and its validity is verified by numerical simulations and experiments. Both numerical simulation and experimental results demonstrate that the proposed characteristic function can not only explain the differences in single-pixel compressive imaging quality for Hadamard coding matrices with different sorting methods but also predict the image reconstruction results of a given measurement matrix. Additionally, the relationship between the proposed characteristic function and the target sparsity in high-quality image reconstruction is established. The characteristic function can serve as a criterion during the optimization of measurement matrices for single-pixel imaging. ObjectiveThe property of the measurement matrix has a great influence on the image reconstruction quality of single-pixel compressive imaging. Optimizing the measurement matrices is a core and crucial technology for single-pixel imaging. However, current optimization methods for measurement matrices often face the problems of local optimization and limited applicability. Additionally, existing analytical theories and methods based on the measurement matrix often fail to explain or predict the image reconstruction quality in many scenarios, and the quantitative relationship among measurement matrix characteristics, target properties, and image reconstruction results is unclear. For example, the reconstruction results vary obviously among different kinds of Hadamard encoding measurement matrices. Therefore, after combining optical imaging systems with compressive sensing theory, it has become an urgent issue for single-pixel compressive imaging to construct a characteristic function that can predict image reconstruction quality. We propose a characteristic function of high-quality image reconstruction for single-pixel compressive imaging to predict the imaging quality of targets with different sparsity, which is helpful for the optimal design of measurement matrices in single-pixel imaging systems.MethodsUnder the same sampling rate, the image reconstruction quality is significantly different for various kinds of Hadamard encoding measurement matrices, which can not be explained by existing compressive sensing theories. By combining compressive sensing theory with the characteristic parameters described in Ref. [23], the Gram matrix is obtained from the measurement matrix and then the relationship between the Gram matrix and the system's point spread function is clarified. Next, according to the point spread function and compressive sensing theory, four characteristic parameters are proposed, including the peak value of the strongest sidelobe, overlapped sidelobe peak value, spatial distance, and spectral cosine similarity. Based on these parameters, an image reconstruction characteristic function F(η) adopted for high-quality single-pixel compressive imaging is constructed. Meanwhile, by calculating the F(η) values of the random Hadamard encoding matrix in different sampling rates η and conducting data fitting, the relationship between the target's sparsity and the characteristic function is established. Furthermore, by changing the target's sparsity, sampling rate, and the type of encoding measurement matrices, the validity of the proposed characteristic function is verified by numerical simulations and experiments.Results and DiscussionsTo demonstrate the validity of the proposed characteristic function, we conduct both numerical simulations and experiments based on the scheme in Fig. 1. Firstly, when the sampling rate η=0.6 is fixed, the sparsity thresholds for Natural, CC, RD, Random, and MP Hadamard encoding matrices are obtained and random grayscale point targets can be stably reconstructed at their respective sparsity thresholds Sε [Fig. 7(a)]. However, the sparsity threshold Sε for the Random Hadamard encoding matrix is much larger than that of the other four Hadamard encoding matrices. What's more, under S>Sε, Natural, CC, RD, and MP Hadamard encoding matrices can not recover the image of the slit shaped target [Figs. 7(b) and 7(c)]. Secondly, according to Fig. 6, under Sε=0.25000, the corresponding sampling rates η for the five kinds of Hadamard encoding matrices above are 0.89100, 0.88600, 0.86600, 0.72800, and 0.89100 respectively. Numerical simulations and experimental results demonstrate that random grayscale point targets can be perfectly reconstructed by all the five kinds of Hadamard encoding matrices when the target's sparsity S=0.25000 (Fig. 8). Additionally, when the sampling rate is η=0.728, only the random sequence Hadamard encoding matrix can accurately restore the radial target with the sparsity S=0.25000. Finally, the universality of the proposed characteristic function is further verified by Bernoulli random encoding matrices, Gaussian random encoding matrices, and Gaussian orthogonal encoding matrices in different representation bases (Tables 2 and 3, and Fig. 9). Meanwhile, Fig. 9 demonstrates that the relationship described by Equation (8) is valid for other common random encoding matrices, which means that the characteristic function can be employed as the objective function in optimizing measurement matrices for single-pixel compressive imaging systems.ConclusionsCombined with the compressed sensing theory, four characteristic parameters based on the point spread function are proposed, including the peak value of the strongest sidelobe, overlapped sidelobe peak value, spatial distance, and spectral cosine similarity. A high-quality image reconstruction characteristic function of single-pixel compressive imaging is constructed and its validity is verified by numerical simulations and experiments. Both numerical simulation and experimental results demonstrate that the proposed characteristic function can not only explain the differences in single-pixel compressive imaging quality for Hadamard coding matrices with different sorting methods but also predict the image reconstruction results of a given measurement matrix. Additionally, the relationship between the proposed characteristic function and the target sparsity in high-quality image reconstruction is established. The characteristic function can serve as a criterion during the optimization of measurement matrices for single-pixel imaging.
Acta Optica Sinica
- Publication Date: Apr. 10, 2024
- Vol. 44, Issue 7, 0711001 (2024)
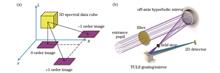
System Design of Extreme Ultraviolet Three-Order Slitless Imaging Spectrometer for Solar Upper Transition Region
Wenjie Shen, Yangguang Xing, Yifan Huang, Jilong Peng, Shuwu Dai, Ying Wang, Chenglin Zhu, Lei Yan, Yue Liu, and Lin Li
ObjectiveSolar transition region is a highly dynamic plasma region with a temperature of 0.02-1 MK in the solar upper atmosphere, which is the key field of solar physics research. Extreme ultraviolet (EUV) multi-order slitless imaging spectrometer can observe the sun in a large field of view (FOV) simultaneously with high spectral, spatial, and temporal resolution. We propose and design a novel solar EUV slitless imaging spectrometer operating at Ne VII 46.52 nm. This instrument can simultaneously correct the off-axis grating aberrations of three diffraction orders in a large FOV (24′×24′) while meeting the requirements of light weight, compact volume, and large aperture. We hope that our three-order slitless spectral imaging strategy and system design can provide a technical scheme that can achieve continuous snapshot high-resolution spectral imaging observations of the upper transition region.MethodsThis instrument utilizes two toroidal uniform line-space (TULS) gratings and a toroidal mirror as the diffraction element and the reflective element respectively to realize a new three-order spectral dispersion structure. The ±1 order dispersion planes overlap with each other and are orthogonal to the 0-order imaging plane without dispersion. We build the paraxial optical model and calculate the initial solution of the optical system. By adopting the multi-configuration of ZEMAX software and the self-defined optimization function, the initial structural parameters of the three-order subsystems are globally optimized by considering the aberration correction conditions of the TULS grating, system resolution requirements, and geometric constraints. Finally, the tolerance analysis is carried out to obtain an optical system with reasonable tolerance allocation.Results and DiscussionsFigs. 6 (a)-(c) show the optical layout of the entire instrument, ±1 order subsystems, and 0-order subsystems respectively. This instrument consists of three hyperboloidal mirrors with off-axis aperture, three Si filters, two TULS gratings, a toroidal mirror, a field aperture, and three independent planar detectors. This entire instrument has a compact optical envelope volume of 950 mm×280 mm×240 mm, the focal length is 3200 mm, and the FOV is 24′×24′. Meanwhile, we employ a Si filter with a thickness of 0.1 μm to suppress the strong solar radiation in the visible band. The transmittance curve is shown in Fig. 7. The same periodic Sc/Si multilayers are coated at all optical surfaces to provide the reflectivity at 46.52 nm. The reflectivity curve is shown in Fig. 8. To reduce the conversion costs of the system, we add constraint conditions in the optimization process to make the final optimized TULS grating and mirror have identical surface height distribution and grating groove density. The surface height distribution is shown in Fig. 9.Figs. 10 (a)-(c) are the RMS radius field map of the spot diagram of the three-order subsystems. Except for the marginal FOV of +1 order, the RMS radius of the spot diagram in the full FOV of each order is less than half of the pixel size. Figs. 11 (a)-(c) are the three-order modulation transfer function (MTF) curves respectively. Except for a few marginal FOV, all orders are greater than 0.6 at the Nyquist frequency (41.67 lp/mm), which is close to the diffraction limit. The image quality evaluation shows that the system has excellent imaging performance.Figs. 12 (a)-(c) are the geometric ensquared energy curves of the instrument. Except for a few marginal FOV, the square full width with 80% ensquared energy at all orders is less than the pixel size. Considering the sampling frequency of the detector, the spatial resolution of the system is 1.547″. By adopting the theoretical calculation method, we obtain the pixel spectral resolution (Δλ) at -1 order and +1 order is 0.00622 nm and 0.00509 nm,respectively. The spot diagram distribution in the full FOV at ±1 order is shown in Figs. 13 (a)-(b). The spot diagram of three wavelengths with a wavelength difference Δλ is obviously separated on the image plane, which indicates that the spectral resolution of the system is 0.0078 nm.Table 5 shows the tolerance limits of key components of the system. Under this tolerance, the RMS radius of the spot diagram on the image plane has a 90% probability of changing within 7.44 μm, and an 80% probability of changing within 6.4 μm. Tolerance analysis is carried out for the system with single grating working simultaneously at three orders. The results are shown in Table 5. The comparison shows that the designed instrument has a looser tolerance.ConclusionsWe propose and design a novel three-order slitless imaging spectrometer. A concave grating array is adopted as the diffractive optical element, and a single grating only works at a single diffraction order to correct the off-axis grating aberration in a large FOV. This system selects Ne VII 46.52 nm spectral line as the central wavelength, and it can realize high-resolution observation under a large FOV (24′×24′). The spatial resolution of the system is 1.547″, and the spectral resolution obtained by spectral data inversion is 0.0078 nm. The performance evaluation and tolerance analysis of the system show that the new imaging spectrometer has excellent imaging performance, compact system volume, and loose tolerance. Thus, it is suitable for deployment on remote-sensing satellite platforms to achieve high-resolution observation of solar upper-layer transition regions. ObjectiveSolar transition region is a highly dynamic plasma region with a temperature of 0.02-1 MK in the solar upper atmosphere, which is the key field of solar physics research. Extreme ultraviolet (EUV) multi-order slitless imaging spectrometer can observe the sun in a large field of view (FOV) simultaneously with high spectral, spatial, and temporal resolution. We propose and design a novel solar EUV slitless imaging spectrometer operating at Ne VII 46.52 nm. This instrument can simultaneously correct the off-axis grating aberrations of three diffraction orders in a large FOV (24′×24′) while meeting the requirements of light weight, compact volume, and large aperture. We hope that our three-order slitless spectral imaging strategy and system design can provide a technical scheme that can achieve continuous snapshot high-resolution spectral imaging observations of the upper transition region.MethodsThis instrument utilizes two toroidal uniform line-space (TULS) gratings and a toroidal mirror as the diffraction element and the reflective element respectively to realize a new three-order spectral dispersion structure. The ±1 order dispersion planes overlap with each other and are orthogonal to the 0-order imaging plane without dispersion. We build the paraxial optical model and calculate the initial solution of the optical system. By adopting the multi-configuration of ZEMAX software and the self-defined optimization function, the initial structural parameters of the three-order subsystems are globally optimized by considering the aberration correction conditions of the TULS grating, system resolution requirements, and geometric constraints. Finally, the tolerance analysis is carried out to obtain an optical system with reasonable tolerance allocation.Results and DiscussionsFigs. 6 (a)-(c) show the optical layout of the entire instrument, ±1 order subsystems, and 0-order subsystems respectively. This instrument consists of three hyperboloidal mirrors with off-axis aperture, three Si filters, two TULS gratings, a toroidal mirror, a field aperture, and three independent planar detectors. This entire instrument has a compact optical envelope volume of 950 mm×280 mm×240 mm, the focal length is 3200 mm, and the FOV is 24′×24′. Meanwhile, we employ a Si filter with a thickness of 0.1 μm to suppress the strong solar radiation in the visible band. The transmittance curve is shown in Fig. 7. The same periodic Sc/Si multilayers are coated at all optical surfaces to provide the reflectivity at 46.52 nm. The reflectivity curve is shown in Fig. 8. To reduce the conversion costs of the system, we add constraint conditions in the optimization process to make the final optimized TULS grating and mirror have identical surface height distribution and grating groove density. The surface height distribution is shown in Fig. 9.Figs. 10 (a)-(c) are the RMS radius field map of the spot diagram of the three-order subsystems. Except for the marginal FOV of +1 order, the RMS radius of the spot diagram in the full FOV of each order is less than half of the pixel size. Figs. 11 (a)-(c) are the three-order modulation transfer function (MTF) curves respectively. Except for a few marginal FOV, all orders are greater than 0.6 at the Nyquist frequency (41.67 lp/mm), which is close to the diffraction limit. The image quality evaluation shows that the system has excellent imaging performance.Figs. 12 (a)-(c) are the geometric ensquared energy curves of the instrument. Except for a few marginal FOV, the square full width with 80% ensquared energy at all orders is less than the pixel size. Considering the sampling frequency of the detector, the spatial resolution of the system is 1.547″. By adopting the theoretical calculation method, we obtain the pixel spectral resolution (Δλ) at -1 order and +1 order is 0.00622 nm and 0.00509 nm,respectively. The spot diagram distribution in the full FOV at ±1 order is shown in Figs. 13 (a)-(b). The spot diagram of three wavelengths with a wavelength difference Δλ is obviously separated on the image plane, which indicates that the spectral resolution of the system is 0.0078 nm.Table 5 shows the tolerance limits of key components of the system. Under this tolerance, the RMS radius of the spot diagram on the image plane has a 90% probability of changing within 7.44 μm, and an 80% probability of changing within 6.4 μm. Tolerance analysis is carried out for the system with single grating working simultaneously at three orders. The results are shown in Table 5. The comparison shows that the designed instrument has a looser tolerance.ConclusionsWe propose and design a novel three-order slitless imaging spectrometer. A concave grating array is adopted as the diffractive optical element, and a single grating only works at a single diffraction order to correct the off-axis grating aberration in a large FOV. This system selects Ne VII 46.52 nm spectral line as the central wavelength, and it can realize high-resolution observation under a large FOV (24′×24′). The spatial resolution of the system is 1.547″, and the spectral resolution obtained by spectral data inversion is 0.0078 nm. The performance evaluation and tolerance analysis of the system show that the new imaging spectrometer has excellent imaging performance, compact system volume, and loose tolerance. Thus, it is suitable for deployment on remote-sensing satellite platforms to achieve high-resolution observation of solar upper-layer transition regions.
Acta Optica Sinica
- Publication Date: Mar. 25, 2024
- Vol. 44, Issue 6, 0611001 (2024)

Imaging Characteristics of One-Dimensional Rotating Synthetic Array for Sparse Aperture
Huiyan Zhang, Ming Liu, Bu Ning, Mei Hui, Liquan Dong, Lingqin Kong, and Yuejin Zhao
ObjectiveOptical sparse aperture (OSA) imaging system is composed of multiple discrete circular sub-apertures, which attempts to obtain a resolution approximately equivalent to a single filled large aperture system with reduced size, cost, and weight. However, compared with a single aperture system, the performance of these sparse arrays strongly relies on various design parameters, such as the number of sub-apertures, their relative positions, and diameters. Due to the discreteness and sparsity of the sparse aperture array, the pupil function is no longer a connected domain, which further reduces the intermediate frequency modulation transfer function (MTF), thus degrading images. To address this issue and enhance the intermediate frequency MTF while improving the imaging quality, a one-dimensional non-redundant three-aperture structure with a sub-aperture spacing ratio of 1∶2 is selected as a foundational array, and the position of the middle sub-aperture is fixed. Then a novel rotating synthetic aperture structure is designed by rotating the base array several times along the baseline direction at different angles within 360°. Both quantitative and qualitative evaluations of simulation and experimental results demonstrate the effectiveness of the proposed method.MethodsThe pupil autocorrelation distribution of one-dimensional multi-aperture arrays is first analyzed. Since the three-aperture structure with a center distance ratio of 1∶2 of two sub-apertures can obtain greater frequency domain coverage with fewer rotation times and a smaller filling factor, this structure is selected as the fundamental array. To create a new synthetic aperture structure, this three-aperture array is rotated by an angle α along the baseline direction around the intermediate sub-aperture. To ensure adherence to the design requirements of the sparse aperture array and prevent overlap between any two sub-apertures in space, various constraint conditions for structural parameters are computed. These constraints encompass parameters such as the center spacings (s1 and s2) of the two sub-apertures, the rotation angle α, and the center position coordinates of the rotated sub-apertures. In addition, the pupil function, point spread function (PSF), and MTF of the rotated arrays are derived. The imaging characteristics of the array structure synthesized by a single rotation are simulated. Notably, the MTF frequency domain coverage of the rotating synthetic aperture is not a simple sum of two directions but rather an expansion, and PSF changes from fringe distribution in one direction to speckle and linear distribution in different directions. In order to increase the coverage of the rotating synthetic aperture in the whole frequency domain, rotation is repeated multiple times to synthesize new apertures. Specifically, the rotation within 360° is performed six times per 2π/7, five times per π/3, four times per 2π/5, three times per π/2, and two times per 2π/3, respectively. The obtained arrays are denoted as OR6, OR5, OR4, OR3, and OR2, respectively.Results and DiscussionsAccording to the theoretical model, with the increase in the single rotation angle in Fig. 4, the energy of MTF and PSF is mainly concentrated in the central region. The sidelobe energy of MTF is continuous along two directions of the pupil structure and gradually presents a point-like discrete distribution in other directions, covering a wider range of frequency domains. Figure 6 shows the pupil structure, as well as the PSF and MTF distributions of Golay-9 and five rotating synthetic arrays. As the number of rotations decreases, the MTF frequency domain coverage of the rotating synthetic aperture becomes smaller and presents a discrete distribution. The PSF energy of the OR6 array is almost all concentrated in the center, which is close to the PSF distribution of the single aperture. The PSF sidelobe of the OR5 and OR4 arrays is converged toward the center. However, the PSF energy distribution of OR3 and OR2 arrays is more discrete, and the sidelobe energy is continuously enhanced. At the same equivalent diameter, the MTF distribution in the Golay-9 array is relatively uniform, but its intensity is low in the middle and high frequency bands, and the PSF presents a discrete circular spot distribution, which degrades the image. In the fx direction in Fig. 7, the MTFs of OR5 and OR3 arrays in the frequency range of 0.4-1.0 are close to that of equivalent single aperture and is higher than that of Golay-9 arrays in the whole spatial frequency range. Moreover, the MTF of OR6, OR4, and OR2 arrays in the frequency range of 0.18-0.6 is higher than that of Golay-9. In the fy direction, the MTFs of four rotating synthetic arrays are greater than that of the Golay-9 array in the frequency range of 0.2-0.6, and the MTF of the OR3 array in the frequency range of 0.15-1.0 is greater than that of the Golay-9 array. At the same equivalent diameter, Mmid-freq, peak signal-to-noise ratio, and structural similarity of rotating synthetic aperture arrays are higher than that of the Golay-9 array.ConclusionsIn this study, the rotating synthetic aperture arrays for improving intermediate frequency MTF and image performance are proposed, which are obtained by rotating a one-dimensional non-redundant three-aperture array several times at different rotation angles within 360°. The MTF of the OR3 array surpasses that of the Golay-9 array across the entire frequency range in both the fxand fy directions. However, three evaluation indexes of the five rotating synthetic arrays are higher than those of the Golay-9 array. According to the experimental results, the normalized gray difference values of the sixth group of horizontal and vertical bar pairs of USAF1951 resolution board images of Golay-9, OR4, and OR3 arrays are compared. The maximum difference values of Golay-9, OR3, and OR4 arrays are 0.2728, 0.3548, 0.5851 for horizontal lines, as well as 0.2291, 0.3499, and 0.4647 for vertical lines, respectively. A higher difference implies greater image contrast. Moreover, the MTF estimation of OR3 and OR4 arrays is higher than that of the Golay-9 array, which proves the validity of the proposed array structure design method. ObjectiveOptical sparse aperture (OSA) imaging system is composed of multiple discrete circular sub-apertures, which attempts to obtain a resolution approximately equivalent to a single filled large aperture system with reduced size, cost, and weight. However, compared with a single aperture system, the performance of these sparse arrays strongly relies on various design parameters, such as the number of sub-apertures, their relative positions, and diameters. Due to the discreteness and sparsity of the sparse aperture array, the pupil function is no longer a connected domain, which further reduces the intermediate frequency modulation transfer function (MTF), thus degrading images. To address this issue and enhance the intermediate frequency MTF while improving the imaging quality, a one-dimensional non-redundant three-aperture structure with a sub-aperture spacing ratio of 1∶2 is selected as a foundational array, and the position of the middle sub-aperture is fixed. Then a novel rotating synthetic aperture structure is designed by rotating the base array several times along the baseline direction at different angles within 360°. Both quantitative and qualitative evaluations of simulation and experimental results demonstrate the effectiveness of the proposed method.MethodsThe pupil autocorrelation distribution of one-dimensional multi-aperture arrays is first analyzed. Since the three-aperture structure with a center distance ratio of 1∶2 of two sub-apertures can obtain greater frequency domain coverage with fewer rotation times and a smaller filling factor, this structure is selected as the fundamental array. To create a new synthetic aperture structure, this three-aperture array is rotated by an angle α along the baseline direction around the intermediate sub-aperture. To ensure adherence to the design requirements of the sparse aperture array and prevent overlap between any two sub-apertures in space, various constraint conditions for structural parameters are computed. These constraints encompass parameters such as the center spacings (s1 and s2) of the two sub-apertures, the rotation angle α, and the center position coordinates of the rotated sub-apertures. In addition, the pupil function, point spread function (PSF), and MTF of the rotated arrays are derived. The imaging characteristics of the array structure synthesized by a single rotation are simulated. Notably, the MTF frequency domain coverage of the rotating synthetic aperture is not a simple sum of two directions but rather an expansion, and PSF changes from fringe distribution in one direction to speckle and linear distribution in different directions. In order to increase the coverage of the rotating synthetic aperture in the whole frequency domain, rotation is repeated multiple times to synthesize new apertures. Specifically, the rotation within 360° is performed six times per 2π/7, five times per π/3, four times per 2π/5, three times per π/2, and two times per 2π/3, respectively. The obtained arrays are denoted as OR6, OR5, OR4, OR3, and OR2, respectively.Results and DiscussionsAccording to the theoretical model, with the increase in the single rotation angle in Fig. 4, the energy of MTF and PSF is mainly concentrated in the central region. The sidelobe energy of MTF is continuous along two directions of the pupil structure and gradually presents a point-like discrete distribution in other directions, covering a wider range of frequency domains. Figure 6 shows the pupil structure, as well as the PSF and MTF distributions of Golay-9 and five rotating synthetic arrays. As the number of rotations decreases, the MTF frequency domain coverage of the rotating synthetic aperture becomes smaller and presents a discrete distribution. The PSF energy of the OR6 array is almost all concentrated in the center, which is close to the PSF distribution of the single aperture. The PSF sidelobe of the OR5 and OR4 arrays is converged toward the center. However, the PSF energy distribution of OR3 and OR2 arrays is more discrete, and the sidelobe energy is continuously enhanced. At the same equivalent diameter, the MTF distribution in the Golay-9 array is relatively uniform, but its intensity is low in the middle and high frequency bands, and the PSF presents a discrete circular spot distribution, which degrades the image. In the fx direction in Fig. 7, the MTFs of OR5 and OR3 arrays in the frequency range of 0.4-1.0 are close to that of equivalent single aperture and is higher than that of Golay-9 arrays in the whole spatial frequency range. Moreover, the MTF of OR6, OR4, and OR2 arrays in the frequency range of 0.18-0.6 is higher than that of Golay-9. In the fy direction, the MTFs of four rotating synthetic arrays are greater than that of the Golay-9 array in the frequency range of 0.2-0.6, and the MTF of the OR3 array in the frequency range of 0.15-1.0 is greater than that of the Golay-9 array. At the same equivalent diameter, Mmid-freq, peak signal-to-noise ratio, and structural similarity of rotating synthetic aperture arrays are higher than that of the Golay-9 array.ConclusionsIn this study, the rotating synthetic aperture arrays for improving intermediate frequency MTF and image performance are proposed, which are obtained by rotating a one-dimensional non-redundant three-aperture array several times at different rotation angles within 360°. The MTF of the OR3 array surpasses that of the Golay-9 array across the entire frequency range in both the fxand fy directions. However, three evaluation indexes of the five rotating synthetic arrays are higher than those of the Golay-9 array. According to the experimental results, the normalized gray difference values of the sixth group of horizontal and vertical bar pairs of USAF1951 resolution board images of Golay-9, OR4, and OR3 arrays are compared. The maximum difference values of Golay-9, OR3, and OR4 arrays are 0.2728, 0.3548, 0.5851 for horizontal lines, as well as 0.2291, 0.3499, and 0.4647 for vertical lines, respectively. A higher difference implies greater image contrast. Moreover, the MTF estimation of OR3 and OR4 arrays is higher than that of the Golay-9 array, which proves the validity of the proposed array structure design method.
Acta Optica Sinica
- Publication Date: Feb. 25, 2024
- Vol. 44, Issue 4, 0411002 (2024)

Calibration Method of Camera Response Function Based on Multi-Exposure Image Sequence
Liuzheng Gao, Banglei Guan, Ang Su, Zhang Li, and Qifeng Yu
ObjectiveThe calibration method based on polynomial fitting can obtain the camera response function (CRF) curve and image exposure ratio under the lack of camera exposure time, and has wide applicability. However, the method has the problems of iterative dispersion and low calibration accuracy, thus affecting its practical applications. We analyze the flow of the traditional polynomial fitting calibration methods and find that the calibration data set contains a large amount of invalid data under the global error function, which not only reduces the quantity of effective calibration data but also causes inaccurate iterative image exposure ratio parameters. To this end, we propose an improved joint local error function calibration method, which can select the calibration data between two images with similar exposures to avoid the introduction of invalid terms and make the data for calculating the polynomial coefficients and exposure ratios consistent. The calibration results of the public data set and an industrial camera show that the improved method has better convergence, the color three-channel CRF curves are more compactly distributed than that of the traditional methods, and the average deviation of the exposure ratio between channels is reduced by 49.83% and 42.25% respectively. The code of the improved calibration method can be downloaded at https://github.com/GuanBanglei/CRF_Calibration.MethodsWe improve the traditional CRF polynomial fitting calibration method to make the calibration results more accurate. Firstly, by analyzing the flow of the traditional calibration method, the reason for the dispersion of the calibration process and the inaccuracy of the results is the large number of invalid terms in the calibration data set. This results in inconsistencies in the set employed to calculate the polynomial coefficients and exposure ratios. Secondly, we rewrite the global error function as a local error function and select the calibration data by dividing two images with adjacent exposure levels into a group to avoid invalid terms in the calibration set. In this case, the set of calculated polynomial coefficients is the same as that of data adopted to compute the exposure ratio. During the iterative computation, the equations for all multiple exposure combinations are united to ensure global optimization. Thirdly, the improved method is tested on the publicly available data set office and an industrial camera respectively. Compared with the traditional method, the improved method outputs more compact CRF curves for the three color channels with better consistency of exposure ratio data.Results and DiscussionsFirstly, our method has better calculation accuracy. From the exposure ratio values among images of different exposure levels in Table 3, we find that the maximum exposure ratio difference between different color channels is 0.1506 and the average difference is 0.0603, while the corresponding values are 0.0664 and 0.0333 respectively in our method. The maximum difference and the average difference have a 59.96% reduction and a 49.83% reduction respectively. For the industrial camera (Table 4), the maximum deviation is reduced by 63.35% and the average deviation by 42.25%. Secondly, a reasonable explanation is given for the distribution of CRF curves for the three color channels. In Fig. 2, the B-channel curve is at the top, the G-channel curve is in the middle, and the R-channel curve is at the bottom. This is because the three color channels have different quantum absorption efficiencies for the spectrum. As shown in Fig. 5, in the absorption spectrum of silicon from 400 to 950 nm, the envelope of the B channel is the smallest, the R channel is the largest, and the G channel is the middle. For the uniform ambient spectrum, the B channel has the smallest pixel value, the R channel has the largest, and the G channel has the middle. It means that for the same pixel value, the B channel represents the largest irradiance, the G channel is the second largest, and the R channel is the smallest. As for the industrial camera, the G channel is slightly smaller than the R channel due to the working wavelength of the ordinary lens, with the working wavelength of ordinary lenses being about 360-780 nm. However, the B channel still indicates the highest radiation, demonstrating the distribution reasonableness of the calibration curves in Fig. 4. Thirdly, polynomials with an odd maximum order are more suitable for convergence during iterations. For the adopted data set, the iterative process is dispersed when the maximum order is 4 and 6, and overfitting occurs in the B and R channels when the maximum order is 5. The optimal result of the Office data set is obtained when the maximum order is 3.ConclusionsThe proposed improved polynomial fitting CRF calibration method can address the inconsistency between the coefficients of the solved iterative polynomials and the set of exposure ratio data, which exists in the traditional calibration method, and enhance the accuracy of the CRF calibration and exposure ratio calculation of the images. The calibration results on the public data set and an industrial camera show that the maximum deviation of the exposure ratios between different color channels is reduced by 59.96% and 63.35% respectively, and the average deviation is reduced by 49.83% and 42.25% respectively. The distribution reasonableness of CRF curves is demonstrated by analyzing the spectral quantum absorption efficiency of the three channels of the color camera. Finally, the relationship between the highest order of the fitting polynomial and the convergence of the CRF calibration curves is discussed to provide guidance for the practical applications of the proposed method. ObjectiveThe calibration method based on polynomial fitting can obtain the camera response function (CRF) curve and image exposure ratio under the lack of camera exposure time, and has wide applicability. However, the method has the problems of iterative dispersion and low calibration accuracy, thus affecting its practical applications. We analyze the flow of the traditional polynomial fitting calibration methods and find that the calibration data set contains a large amount of invalid data under the global error function, which not only reduces the quantity of effective calibration data but also causes inaccurate iterative image exposure ratio parameters. To this end, we propose an improved joint local error function calibration method, which can select the calibration data between two images with similar exposures to avoid the introduction of invalid terms and make the data for calculating the polynomial coefficients and exposure ratios consistent. The calibration results of the public data set and an industrial camera show that the improved method has better convergence, the color three-channel CRF curves are more compactly distributed than that of the traditional methods, and the average deviation of the exposure ratio between channels is reduced by 49.83% and 42.25% respectively. The code of the improved calibration method can be downloaded at https://github.com/GuanBanglei/CRF_Calibration.MethodsWe improve the traditional CRF polynomial fitting calibration method to make the calibration results more accurate. Firstly, by analyzing the flow of the traditional calibration method, the reason for the dispersion of the calibration process and the inaccuracy of the results is the large number of invalid terms in the calibration data set. This results in inconsistencies in the set employed to calculate the polynomial coefficients and exposure ratios. Secondly, we rewrite the global error function as a local error function and select the calibration data by dividing two images with adjacent exposure levels into a group to avoid invalid terms in the calibration set. In this case, the set of calculated polynomial coefficients is the same as that of data adopted to compute the exposure ratio. During the iterative computation, the equations for all multiple exposure combinations are united to ensure global optimization. Thirdly, the improved method is tested on the publicly available data set office and an industrial camera respectively. Compared with the traditional method, the improved method outputs more compact CRF curves for the three color channels with better consistency of exposure ratio data.Results and DiscussionsFirstly, our method has better calculation accuracy. From the exposure ratio values among images of different exposure levels in Table 3, we find that the maximum exposure ratio difference between different color channels is 0.1506 and the average difference is 0.0603, while the corresponding values are 0.0664 and 0.0333 respectively in our method. The maximum difference and the average difference have a 59.96% reduction and a 49.83% reduction respectively. For the industrial camera (Table 4), the maximum deviation is reduced by 63.35% and the average deviation by 42.25%. Secondly, a reasonable explanation is given for the distribution of CRF curves for the three color channels. In Fig. 2, the B-channel curve is at the top, the G-channel curve is in the middle, and the R-channel curve is at the bottom. This is because the three color channels have different quantum absorption efficiencies for the spectrum. As shown in Fig. 5, in the absorption spectrum of silicon from 400 to 950 nm, the envelope of the B channel is the smallest, the R channel is the largest, and the G channel is the middle. For the uniform ambient spectrum, the B channel has the smallest pixel value, the R channel has the largest, and the G channel has the middle. It means that for the same pixel value, the B channel represents the largest irradiance, the G channel is the second largest, and the R channel is the smallest. As for the industrial camera, the G channel is slightly smaller than the R channel due to the working wavelength of the ordinary lens, with the working wavelength of ordinary lenses being about 360-780 nm. However, the B channel still indicates the highest radiation, demonstrating the distribution reasonableness of the calibration curves in Fig. 4. Thirdly, polynomials with an odd maximum order are more suitable for convergence during iterations. For the adopted data set, the iterative process is dispersed when the maximum order is 4 and 6, and overfitting occurs in the B and R channels when the maximum order is 5. The optimal result of the Office data set is obtained when the maximum order is 3.ConclusionsThe proposed improved polynomial fitting CRF calibration method can address the inconsistency between the coefficients of the solved iterative polynomials and the set of exposure ratio data, which exists in the traditional calibration method, and enhance the accuracy of the CRF calibration and exposure ratio calculation of the images. The calibration results on the public data set and an industrial camera show that the maximum deviation of the exposure ratios between different color channels is reduced by 59.96% and 63.35% respectively, and the average deviation is reduced by 49.83% and 42.25% respectively. The distribution reasonableness of CRF curves is demonstrated by analyzing the spectral quantum absorption efficiency of the three channels of the color camera. Finally, the relationship between the highest order of the fitting polynomial and the convergence of the CRF calibration curves is discussed to provide guidance for the practical applications of the proposed method.
Acta Optica Sinica
- Publication Date: Feb. 25, 2024
- Vol. 44, Issue 4, 0411001 (2024)
Statistical p-Norm Distribution Analysis of Noise in Photon-Counting Detector Projection Data
Jie Guo, Ailong Cai, Shaoyu Wang, Zhizhong Zheng, Lei Li, and Bin Yan
ObjectiveSpectral computed tomography (CT) is a technology that utilizes the differences in attenuation coefficients of substances across different channels, which can demonstrate significant capabilities in material identification and analysis. Particularly, photon-counting spectral CT, which significantly curtails electronic noise and enhances resolution, signifies the latest technological advancements in CT imaging. However, effects such as photon starvation, charge sharing, and pulse pile-up engender severe noise in photon-counting spectral CT, directly undermining the image reconstruction quality and hampering the applications of photon-counting spectral CT technology. Our paramount research focus lies in accurately characterizing the statistical properties of projection data noise in photon-counting detectors, designing precise spectral CT reconstruction algorithms, and suppressing noise.MethodsInitially, a theoretical analysis is conducted on the statistical noise characteristics in the projection data of photon-counting detectors. Specifically, by comprehensively considering the statistical distribution of photon flux and electronic noise in the projection data, where photon flux can be characterized by a compound Poisson distribution and approximated by a Gamma distribution, and electronic noise follows a Gaussian distribution. A theoretical noise distribution model of projection data is derived by the Bayesian formula. Subsequently, a statistical inference is carried out on the proposed theoretical noise distribution model of projection data. On the one hand, the probability distribution of the noise is fitted via actual data experimentation. On the other hand, a goodness-of-fit test is conducted on the theoretical noise distribution model. Ultimately, by adopting time series analysis for prediction, the predicted values are employed to restore outliers in the projection data.Results and DiscussionsWe derive a rigorous theoretical noise distribution model in photon-counting spectral CT projection data (Eq. 9), bearing a similar expression to the univariate p-norm distribution. The rationality of characterizing the noise distribution of projection data using univariate p-norm distribution is then analyzed from three perspectives. By fitting the probability distribution of the actual data, the proposed univariate p-norm noise distribution model aligns more closely with the actual data than Gaussian, Poisson, and Gamma distributions, especially under extremely low photon flux, and the fitting degree of the proposed noise distribution model is optimal (Fig. 2). A goodness-of-fit test is conducted on the proposed noise distribution. The results are shown in Table 1. The proposed noise distribution is consistent with various collected datasets and consistency is the best in datasets with low photon flux. Lastly, the restoration of outliers using predicted values shows clear improvement from both visual images (Fig. 4) and quantitative assessments (Table 2). The proposed univariate p-norm distribution aptly characterizes the statistical properties of photon-counting spectral CT. However, the probability density function of the univariate p-norm distribution is challenging to calculate, and it should be transformed into a linear combination of Gaussian distribution and Laplace distribution for approximation, according to the p-value selection.ConclusionsWe investigate the statistical noise characteristics in the projection data of photon-counting spectral CT, and propose to employ univariate p-norm distribution to model the projection data noise. The distribution is verified by fitting actual data probability density functions and statistical inference tests. The univariate p-norm distribution can fully characterize the statistical law of observational errors. Especially under the insufficient number of photons, the univariate p-norm distribution can reach optimal when fitting the actual data distribution. The statistical probability model of projection data from the devised photon-counting detection system allows for an in-depth analysis of the system performance and accurate noise simulation during simulation experiments, and provides an accurate objective function for optimizing the likelihood functions in statistical iteration reconstruction. We explore the statistical noise characteristics of projection data in photon-counting detectors, enrich the theoretical results of X-ray spectral CT imaging systems, and provide theoretical support for the design and optimization of multi-spectral image reconstruction. ObjectiveSpectral computed tomography (CT) is a technology that utilizes the differences in attenuation coefficients of substances across different channels, which can demonstrate significant capabilities in material identification and analysis. Particularly, photon-counting spectral CT, which significantly curtails electronic noise and enhances resolution, signifies the latest technological advancements in CT imaging. However, effects such as photon starvation, charge sharing, and pulse pile-up engender severe noise in photon-counting spectral CT, directly undermining the image reconstruction quality and hampering the applications of photon-counting spectral CT technology. Our paramount research focus lies in accurately characterizing the statistical properties of projection data noise in photon-counting detectors, designing precise spectral CT reconstruction algorithms, and suppressing noise.MethodsInitially, a theoretical analysis is conducted on the statistical noise characteristics in the projection data of photon-counting detectors. Specifically, by comprehensively considering the statistical distribution of photon flux and electronic noise in the projection data, where photon flux can be characterized by a compound Poisson distribution and approximated by a Gamma distribution, and electronic noise follows a Gaussian distribution. A theoretical noise distribution model of projection data is derived by the Bayesian formula. Subsequently, a statistical inference is carried out on the proposed theoretical noise distribution model of projection data. On the one hand, the probability distribution of the noise is fitted via actual data experimentation. On the other hand, a goodness-of-fit test is conducted on the theoretical noise distribution model. Ultimately, by adopting time series analysis for prediction, the predicted values are employed to restore outliers in the projection data.Results and DiscussionsWe derive a rigorous theoretical noise distribution model in photon-counting spectral CT projection data (Eq. 9), bearing a similar expression to the univariate p-norm distribution. The rationality of characterizing the noise distribution of projection data using univariate p-norm distribution is then analyzed from three perspectives. By fitting the probability distribution of the actual data, the proposed univariate p-norm noise distribution model aligns more closely with the actual data than Gaussian, Poisson, and Gamma distributions, especially under extremely low photon flux, and the fitting degree of the proposed noise distribution model is optimal (Fig. 2). A goodness-of-fit test is conducted on the proposed noise distribution. The results are shown in Table 1. The proposed noise distribution is consistent with various collected datasets and consistency is the best in datasets with low photon flux. Lastly, the restoration of outliers using predicted values shows clear improvement from both visual images (Fig. 4) and quantitative assessments (Table 2). The proposed univariate p-norm distribution aptly characterizes the statistical properties of photon-counting spectral CT. However, the probability density function of the univariate p-norm distribution is challenging to calculate, and it should be transformed into a linear combination of Gaussian distribution and Laplace distribution for approximation, according to the p-value selection.ConclusionsWe investigate the statistical noise characteristics in the projection data of photon-counting spectral CT, and propose to employ univariate p-norm distribution to model the projection data noise. The distribution is verified by fitting actual data probability density functions and statistical inference tests. The univariate p-norm distribution can fully characterize the statistical law of observational errors. Especially under the insufficient number of photons, the univariate p-norm distribution can reach optimal when fitting the actual data distribution. The statistical probability model of projection data from the devised photon-counting detection system allows for an in-depth analysis of the system performance and accurate noise simulation during simulation experiments, and provides an accurate objective function for optimizing the likelihood functions in statistical iteration reconstruction. We explore the statistical noise characteristics of projection data in photon-counting detectors, enrich the theoretical results of X-ray spectral CT imaging systems, and provide theoretical support for the design and optimization of multi-spectral image reconstruction.
Acta Optica Sinica
- Publication Date: Feb. 10, 2024
- Vol. 44, Issue 3, 0311003 (2024)
A Polarization-Free Imaging Technique Based on Unsharp Masking Model
Chang Gao, Zhiqiang Liu, Hao Liu, Jiacheng Ma, and Mao Ye
ObjectiveLiquid crystal lens is an emerging liquid crystal device that can be electrically controlled to modulate the focus, zoom, and depth measurement without mechanical movement, and thus it is widely employed in many fields such as photographic camera, microscopic imaging, and virtual reality. Due to the anisotropy of the liquid crystal material, the liquid crystal lens can only modulate the extraordinary ray, and the ordinary ray is not modulated, which causes reduced image contrast. Optical imaging systems of liquid crystal lens can be retrofitted with polarizing devices to remove the ordinary ray component of the incident light. However, the utilization of polarizers drastically reduces the optical flux and degrades the imaging quality. Additionally, there are three main polarizer-free imaging techniques. The first one is to adopt blue-phase liquid crystals instead of nematic-phase liquid crystals to prepare liquid crystal lenses. However, the blue-phase liquid crystal features small birefringence effect, narrow temperature range, and high voltage, and has not yet reached the practical level. The second is to leverage multilayer liquid crystals instead of single-layer liquid crystals to modulate the two components of incident light. However, the multilayer liquid crystal structure increases the thickness and fabrication cost of the device. The third one is to apply a polarizer-free imaging algorithm and an innovative combination of unsharp masking models to acquire high-quality images.MethodsThe non-ideal low-frequency component introduced by the unmodulated extraordinary ray is decreased by utilizing an optical imaging system of liquid crystal lens with a polarizer-free device to acquire one focused image and one unfocused image respectively and perform image processing on the two images. Meanwhile, the unsharp masking model for polarizer-free imaging is proposed to analyze pixel value changes of the images to estimate the percentage of the ordinary ray component, and then the unfocused and focused images are adopted to obtain a high-contrast image.Results and DiscussionsThe optical properties of the liquid crystal lens in the experiment are examined. The experimental results show that the optical focal length is linearly related to the optical aberration of an ideal glass lens. Additionally, the liquid crystal lens is close to the ideal optical aberration of a glass lens with high imaging quality, and can be adopted as a focusing unit in the imaging system (Fig. 7). A polarizer is placed in front of the liquid crystal lens to remove the ordinary ray component in the incident light, and different voltages are applied to the ends of the liquid crystal lens to capture the ISO 12233 chart. The fMTF50 is to characterize the resolution capability of the system and evaluate the image quality to determine the optimal operating voltage value (Fig. 10). Meanwhile, we adopt fMTF50 to characterize the system's resolving power, evaluate the image quality, and then determine the optimal operating voltage value (Fig. 10). Focus and non-focus images are captured, the values are set to process the two images, and the unsharp masking model is adopted for edge detection, with observations conducted on whether there is any abnormal "depression" and "bulge". The polarization direction of the incident polarized light is detected and recorded (Table 1). The relationship between the polarization angle and the ideal and actual values is plotted, and the values obtained by experimental measurements are near the ideal value curve, which indicates that the experimental method can obtain the actual values more accurately and process the images (Fig. 14). Meanwhile, we photograph the actual scene and process the image, and the image obtained by the imaging method of polarizer-free liquid crystal lens is clear and natural with high contrast. The value calculated by the unsharp masking model can be applied to the actual measurement (Fig. 16).ConclusionsWe propose a polarizer-free imaging technique of liquid crystal lens based on the unsharp masking model and experimentally verify the feasibility of the technique. The technique combines the unsharp masking model in image processing to estimate the proportion of the ordinary ray component in ambient light by analyzing the changes of the image pixel. Then, this value is employed to process the focused and unfocused images to reduce the non-ideal low-frequency component introduced by non-modulated unusual light and obtain a natural high-quality image. Additionally, values of the ratio of the o-light component are obtained by simulating the ambient light incidence conditions with different polarization directions, and the experimental results are consistent with the theoretical analysis. ObjectiveLiquid crystal lens is an emerging liquid crystal device that can be electrically controlled to modulate the focus, zoom, and depth measurement without mechanical movement, and thus it is widely employed in many fields such as photographic camera, microscopic imaging, and virtual reality. Due to the anisotropy of the liquid crystal material, the liquid crystal lens can only modulate the extraordinary ray, and the ordinary ray is not modulated, which causes reduced image contrast. Optical imaging systems of liquid crystal lens can be retrofitted with polarizing devices to remove the ordinary ray component of the incident light. However, the utilization of polarizers drastically reduces the optical flux and degrades the imaging quality. Additionally, there are three main polarizer-free imaging techniques. The first one is to adopt blue-phase liquid crystals instead of nematic-phase liquid crystals to prepare liquid crystal lenses. However, the blue-phase liquid crystal features small birefringence effect, narrow temperature range, and high voltage, and has not yet reached the practical level. The second is to leverage multilayer liquid crystals instead of single-layer liquid crystals to modulate the two components of incident light. However, the multilayer liquid crystal structure increases the thickness and fabrication cost of the device. The third one is to apply a polarizer-free imaging algorithm and an innovative combination of unsharp masking models to acquire high-quality images.MethodsThe non-ideal low-frequency component introduced by the unmodulated extraordinary ray is decreased by utilizing an optical imaging system of liquid crystal lens with a polarizer-free device to acquire one focused image and one unfocused image respectively and perform image processing on the two images. Meanwhile, the unsharp masking model for polarizer-free imaging is proposed to analyze pixel value changes of the images to estimate the percentage of the ordinary ray component, and then the unfocused and focused images are adopted to obtain a high-contrast image.Results and DiscussionsThe optical properties of the liquid crystal lens in the experiment are examined. The experimental results show that the optical focal length is linearly related to the optical aberration of an ideal glass lens. Additionally, the liquid crystal lens is close to the ideal optical aberration of a glass lens with high imaging quality, and can be adopted as a focusing unit in the imaging system (Fig. 7). A polarizer is placed in front of the liquid crystal lens to remove the ordinary ray component in the incident light, and different voltages are applied to the ends of the liquid crystal lens to capture the ISO 12233 chart. The fMTF50 is to characterize the resolution capability of the system and evaluate the image quality to determine the optimal operating voltage value (Fig. 10). Meanwhile, we adopt fMTF50 to characterize the system's resolving power, evaluate the image quality, and then determine the optimal operating voltage value (Fig. 10). Focus and non-focus images are captured, the values are set to process the two images, and the unsharp masking model is adopted for edge detection, with observations conducted on whether there is any abnormal "depression" and "bulge". The polarization direction of the incident polarized light is detected and recorded (Table 1). The relationship between the polarization angle and the ideal and actual values is plotted, and the values obtained by experimental measurements are near the ideal value curve, which indicates that the experimental method can obtain the actual values more accurately and process the images (Fig. 14). Meanwhile, we photograph the actual scene and process the image, and the image obtained by the imaging method of polarizer-free liquid crystal lens is clear and natural with high contrast. The value calculated by the unsharp masking model can be applied to the actual measurement (Fig. 16).ConclusionsWe propose a polarizer-free imaging technique of liquid crystal lens based on the unsharp masking model and experimentally verify the feasibility of the technique. The technique combines the unsharp masking model in image processing to estimate the proportion of the ordinary ray component in ambient light by analyzing the changes of the image pixel. Then, this value is employed to process the focused and unfocused images to reduce the non-ideal low-frequency component introduced by non-modulated unusual light and obtain a natural high-quality image. Additionally, values of the ratio of the o-light component are obtained by simulating the ambient light incidence conditions with different polarization directions, and the experimental results are consistent with the theoretical analysis.
Acta Optica Sinica
- Publication Date: Feb. 10, 2024
- Vol. 44, Issue 3, 0311002 (2024)
Optimal Number of Spectral Channels for Gaussian Filter Sets in Multispectral Color Imaging
Suixian Li, Qiang Li, Jinping He, Xufen Xie, Fuzheng Zhang, and Jing Liang
ObjectiveAs the number of spectral channels significantly affects the system complexity, data load, time resolution, and spatial resolution of images, a multispectral color imaging system that aims to accurately reproduce the visible spectrum reflectance of object surfaces is preferred using a limited number of spectral channels. However, seldom literature has been explained statistically for the determination of numbers of spectral channels. The heuristic or even arbitrary number of spectral channel configurations challenges the purpose of multispectral color imaging for accurate spectral reconstruction and color reproduction. It is even more crucial with the emergence of various modalities of color imaging sensors, such as those of with liquid crystal tunable filters (LCTFs) and multispectral filter arrays (MSFAs) and recently developed nanostructure color filters. Previous evidence shows that the spectral transmittance of the optimal filter set for multispectral color cameras is Gaussian curves. We build upon the previously proposed multi-objective optimization method for filter selection with specific channels and systematically explore the way to determine the optimal number of spectral channels for typical multispectral color imaging systems with filters modeled by Gaussian functions.MethodsThe workflow for optimizing the number of spectral channels in the multispectral color imaging system studied in this research is illustrated in Fig. 1. Firstly, we provide a systematic theoretical presentation of the spectral sensitivity optimization by filter selection for the broadband multispectral imaging and the method for the channel numbers optimization, which could scarcely be found in the literature published so far to the best of our knowledge. The highlight of the proposed method is built upon the previously proposed multi-objective optimization method for filter selection, and we systematically explore the way to determine the optimal number of spectral channels for typical multispectral color imaging systems. Then, we investigate the optimal number of channels experimentally. Using the Munsell spectral reflectance dataset to construct the spectral imaging targets, imaging simulations and reflectance reconstruction under 10 noise levels are conducted by the spectral sensitivity of an actual CCD image sensor, the spectral distribution of the D65 illuminate, and the transmittance curves of the filters generated by Gaussian filter model. it involves 29 virtual multispectral cameras, or in other words, the channel numbers are 3-31, respectively.Results1) Determination of the optimal number of channels. The optimal filters' serial numbers and the corresponding accumulative scores under different channel numbers are presented in Table 1. Figure 3 illustrates the concentration index of multi-objective functions (CMFs) under different channel numbers. Moreover, Fig. 4 depicts the performance of the best filter sets in terms of CIEDE2000 and MSE, respectively, under different channel numbers. Additionally, Fig. 5 displays the accumulative scores of the best filter sets' performance within the 29 numbers of channels.2) Characterization of the filter set with the optimal channel number. The optimal number of channels for a multispectral color imaging system is 5 (Fig. 6) when the maximum number of channels is not greater than 8. Figure 7 presents the transmittance curves of the optimal Gaussian filter sets with five and nine channels, respectively. Table 3 presents the characteristics of the optimal Gaussian filter sets with five channels under two different illuminates. Table 4 compares the performance indices of the optimal Gaussian filter sets with five channels under different illuminates.ConclusionsFrom the results, the following six items could be concluded: 1) For broadband multispectral color imaging, increasing the number of channels does not always lead to an improvement in spectral reconstruction accuracy. It is observed that a smaller number of spectral channels has the potential to simultaneously satisfy the requirements of color difference reproduction and spectral reconstruction error accuracy; 2) By employing the multi-objective optimization method within the optimal filter range for each channel, that is to say, extending the concept of CMF, a unique optimal number of channels can be obtained; 3) In general, a higher noise level (i. e., a lower signal-to-noise ratio) often indicates worse performance indicators, but the specific performance indicators may exhibit varying nonlinear characteristics with the noise; 4) CIEDE2000 is more sensitive to noise when compared to the relevant indicators, MSE and PSNR, as indicated in Fig. 7, and the latter two are more discrete; 5) Based on the principles of multi-objective optimization in this study, the optimal number of spectral channels for Gaussian filters with less than eight channels is 5 under the illuminant D65. Moreover, compared with illuminant A, D65 enhances the performance of the Gaussian filters with five channels in terms of spectral reconstruction and color reproduction; 6) Optimal filters with the same number of channels may differ under different spectral distribution light sources. Differences can be observed in terms of the geometric characteristics of transmittance curves, primarily the varying bandwidths. Furthermore, significant differences can be observed in performance, including color reproduction and spectral reconstruction.Briefly, the spectral transmittance of the optimal color filter set can be described by a series of Gaussian curves, and the number of spectral channels significantly impacts its performance and complexity. We systematically explore the way to determine the optimal number of spectral channels for typical multispectral color imaging systems. It would be of great theoretical and practical significance to model the spectral channel of color imaging systems with different physical modalities as Gaussian spectral channels and then explore the necessary color filter channels to optimize multi-spectral color imaging systems. ObjectiveAs the number of spectral channels significantly affects the system complexity, data load, time resolution, and spatial resolution of images, a multispectral color imaging system that aims to accurately reproduce the visible spectrum reflectance of object surfaces is preferred using a limited number of spectral channels. However, seldom literature has been explained statistically for the determination of numbers of spectral channels. The heuristic or even arbitrary number of spectral channel configurations challenges the purpose of multispectral color imaging for accurate spectral reconstruction and color reproduction. It is even more crucial with the emergence of various modalities of color imaging sensors, such as those of with liquid crystal tunable filters (LCTFs) and multispectral filter arrays (MSFAs) and recently developed nanostructure color filters. Previous evidence shows that the spectral transmittance of the optimal filter set for multispectral color cameras is Gaussian curves. We build upon the previously proposed multi-objective optimization method for filter selection with specific channels and systematically explore the way to determine the optimal number of spectral channels for typical multispectral color imaging systems with filters modeled by Gaussian functions.MethodsThe workflow for optimizing the number of spectral channels in the multispectral color imaging system studied in this research is illustrated in Fig. 1. Firstly, we provide a systematic theoretical presentation of the spectral sensitivity optimization by filter selection for the broadband multispectral imaging and the method for the channel numbers optimization, which could scarcely be found in the literature published so far to the best of our knowledge. The highlight of the proposed method is built upon the previously proposed multi-objective optimization method for filter selection, and we systematically explore the way to determine the optimal number of spectral channels for typical multispectral color imaging systems. Then, we investigate the optimal number of channels experimentally. Using the Munsell spectral reflectance dataset to construct the spectral imaging targets, imaging simulations and reflectance reconstruction under 10 noise levels are conducted by the spectral sensitivity of an actual CCD image sensor, the spectral distribution of the D65 illuminate, and the transmittance curves of the filters generated by Gaussian filter model. it involves 29 virtual multispectral cameras, or in other words, the channel numbers are 3-31, respectively.Results1) Determination of the optimal number of channels. The optimal filters' serial numbers and the corresponding accumulative scores under different channel numbers are presented in Table 1. Figure 3 illustrates the concentration index of multi-objective functions (CMFs) under different channel numbers. Moreover, Fig. 4 depicts the performance of the best filter sets in terms of CIEDE2000 and MSE, respectively, under different channel numbers. Additionally, Fig. 5 displays the accumulative scores of the best filter sets' performance within the 29 numbers of channels.2) Characterization of the filter set with the optimal channel number. The optimal number of channels for a multispectral color imaging system is 5 (Fig. 6) when the maximum number of channels is not greater than 8. Figure 7 presents the transmittance curves of the optimal Gaussian filter sets with five and nine channels, respectively. Table 3 presents the characteristics of the optimal Gaussian filter sets with five channels under two different illuminates. Table 4 compares the performance indices of the optimal Gaussian filter sets with five channels under different illuminates.ConclusionsFrom the results, the following six items could be concluded: 1) For broadband multispectral color imaging, increasing the number of channels does not always lead to an improvement in spectral reconstruction accuracy. It is observed that a smaller number of spectral channels has the potential to simultaneously satisfy the requirements of color difference reproduction and spectral reconstruction error accuracy; 2) By employing the multi-objective optimization method within the optimal filter range for each channel, that is to say, extending the concept of CMF, a unique optimal number of channels can be obtained; 3) In general, a higher noise level (i. e., a lower signal-to-noise ratio) often indicates worse performance indicators, but the specific performance indicators may exhibit varying nonlinear characteristics with the noise; 4) CIEDE2000 is more sensitive to noise when compared to the relevant indicators, MSE and PSNR, as indicated in Fig. 7, and the latter two are more discrete; 5) Based on the principles of multi-objective optimization in this study, the optimal number of spectral channels for Gaussian filters with less than eight channels is 5 under the illuminant D65. Moreover, compared with illuminant A, D65 enhances the performance of the Gaussian filters with five channels in terms of spectral reconstruction and color reproduction; 6) Optimal filters with the same number of channels may differ under different spectral distribution light sources. Differences can be observed in terms of the geometric characteristics of transmittance curves, primarily the varying bandwidths. Furthermore, significant differences can be observed in performance, including color reproduction and spectral reconstruction.Briefly, the spectral transmittance of the optimal color filter set can be described by a series of Gaussian curves, and the number of spectral channels significantly impacts its performance and complexity. We systematically explore the way to determine the optimal number of spectral channels for typical multispectral color imaging systems. It would be of great theoretical and practical significance to model the spectral channel of color imaging systems with different physical modalities as Gaussian spectral channels and then explore the necessary color filter channels to optimize multi-spectral color imaging systems.
Acta Optica Sinica
- Publication Date: Feb. 10, 2024
- Vol. 44, Issue 3, 0311001 (2024)
Design Method of Broad-Spectrum Optical System by Genetic Algorithm
Yang Chen, Yiqing Wang, Ming Gao, and Bin Feng
ObjectiveBroad-spectrum optical systems have superior performance. They can obtain more comprehensive and accurate target information and are conducive to enhancing the detection and identification capabilities of optoelectronic equipment. In addition, they have an irreplaceable role in complex environments. However, their design is often difficult, and the current main optical design method is to optimize the selected initial structure, but the initial structure of the broad-spectrum optical system is inefficiently constructed. Therefore, the design cycle is long, and it relies too much on the experience of the designers. In this paper, we explore the design method of broad-spectrum optical systems, analyze the system's confocal and co-image plane conditions from the theoretical level, and focus on the initial structure construction method of broad-spectrum systems based on a genetic algorithm.MethodsFirstly, a multi-band equal focus method based on optical focus matching is proposed to derive the equal optical focus condition by taking a system with two bands and two optical groups as an example, and the system's focal lengths in each band are set to be equal by reasonably allocating the optical focus of each optical group. Then, in order to meet the different wavelengths of the common image plane imaging, the geometric optics formula recursively obtains the combined system of equal image plane conditions. The idea of a genetic algorithm is used to independently construct the optical group composition and structure form of the broad-spectrum optical system and iteratively solve the optimal initial structure, and the selection of the optimal group is based on the experience of the designers, which is mainly considered in the differences in the focal lengths of different wavelengths, the differences in the position of the imaging surface, the distribution of the optical focal lengths, the ratio of the lens diameter to thickness, and the thickness of the edge of the lens, and other aspects. Finally, the selected optimal initial structure is optimized to obtain a broad-spectrum optical system with a small number of lenses, small volume, light weight, and good imaging quality.Results and DiscussionsFor the same target, different focal lengths will lead to differences in the position and size of the image, and with the broadening of the spectral range, the imaging differences increase, which will seriously reduce the imaging quality of the system. The theoretical derivation of this paper obtains the conditions of equal focal lengths and co-image surfaces, which can solve this problem. For the optimal initial structure construction of the transmissive system, this paper independently constructs the optical group composition and structural form of the system by genetic algorithm, while the existing papers use optimization algorithms for the design of reflective systems, such as the design of reflective free-form surfaces. In the initial structure construction process of such systems, the parameters of the incident light and the requirements of the outgoing light are determined, and the algorithm process actually fits the reflective surface according to the laws of geometrical optics under the premise of known incident and outgoing light. In contrast, the transmissive system contains multiple optical groups; the light propagation path inside the system is completely uncertain, and the number of optical groups and the structure form are all unknown. Therefore, the main framework strategy and process of the broad-spectrum initial structure construction algorithm in this paper are completely different. In addition, we generate many possible optimal solution results through the powerful computational ability of the algorithm, which ensures a high probability of occurrence of the optimal solution by the number and effectively prevents the algorithm from falling into the local optimum. The results of the algorithm (Fig. 3) indicate that it can efficiently generate a large number of excellent initial structures of the broad-spectrum system, providing training samples for the later AI-based optical system design.ConclusionsIn this paper, we derive the broad-spectrum co-focal distance and co-image plane equations, determine the focal distance difference and image plane difference fitness function, and establish the genetic algorithm structure parameter variation and material crossover method. In order to verify the feasibility and efficiency of the method, a visible and near-infrared broad-spectrum optical system is designed, and the system has an imaging band of 0.4–1.2 μm and a focal length of 40 mm. The difference in the focal length within the range of the band is less than 0.03 mm, and the imaging quality is good in the broad-spectrum range. The design results show that the genetic algorithm-based broad-spectrum optical system construction method can generate 1024 excellent populations at a time, of which 407 iterative individuals can meet the requirements of the objective function. The appropriate optimal solution is input into the Zemax software for optimization, and a broad-spectrum optical system that meets the requirements can be obtained very quickly. In summary, the proposed genetic algorithm can shorten the design cycle and improve the design efficiency of broad-spectrum optical systems. ObjectiveBroad-spectrum optical systems have superior performance. They can obtain more comprehensive and accurate target information and are conducive to enhancing the detection and identification capabilities of optoelectronic equipment. In addition, they have an irreplaceable role in complex environments. However, their design is often difficult, and the current main optical design method is to optimize the selected initial structure, but the initial structure of the broad-spectrum optical system is inefficiently constructed. Therefore, the design cycle is long, and it relies too much on the experience of the designers. In this paper, we explore the design method of broad-spectrum optical systems, analyze the system's confocal and co-image plane conditions from the theoretical level, and focus on the initial structure construction method of broad-spectrum systems based on a genetic algorithm.MethodsFirstly, a multi-band equal focus method based on optical focus matching is proposed to derive the equal optical focus condition by taking a system with two bands and two optical groups as an example, and the system's focal lengths in each band are set to be equal by reasonably allocating the optical focus of each optical group. Then, in order to meet the different wavelengths of the common image plane imaging, the geometric optics formula recursively obtains the combined system of equal image plane conditions. The idea of a genetic algorithm is used to independently construct the optical group composition and structure form of the broad-spectrum optical system and iteratively solve the optimal initial structure, and the selection of the optimal group is based on the experience of the designers, which is mainly considered in the differences in the focal lengths of different wavelengths, the differences in the position of the imaging surface, the distribution of the optical focal lengths, the ratio of the lens diameter to thickness, and the thickness of the edge of the lens, and other aspects. Finally, the selected optimal initial structure is optimized to obtain a broad-spectrum optical system with a small number of lenses, small volume, light weight, and good imaging quality.Results and DiscussionsFor the same target, different focal lengths will lead to differences in the position and size of the image, and with the broadening of the spectral range, the imaging differences increase, which will seriously reduce the imaging quality of the system. The theoretical derivation of this paper obtains the conditions of equal focal lengths and co-image surfaces, which can solve this problem. For the optimal initial structure construction of the transmissive system, this paper independently constructs the optical group composition and structural form of the system by genetic algorithm, while the existing papers use optimization algorithms for the design of reflective systems, such as the design of reflective free-form surfaces. In the initial structure construction process of such systems, the parameters of the incident light and the requirements of the outgoing light are determined, and the algorithm process actually fits the reflective surface according to the laws of geometrical optics under the premise of known incident and outgoing light. In contrast, the transmissive system contains multiple optical groups; the light propagation path inside the system is completely uncertain, and the number of optical groups and the structure form are all unknown. Therefore, the main framework strategy and process of the broad-spectrum initial structure construction algorithm in this paper are completely different. In addition, we generate many possible optimal solution results through the powerful computational ability of the algorithm, which ensures a high probability of occurrence of the optimal solution by the number and effectively prevents the algorithm from falling into the local optimum. The results of the algorithm (Fig. 3) indicate that it can efficiently generate a large number of excellent initial structures of the broad-spectrum system, providing training samples for the later AI-based optical system design.ConclusionsIn this paper, we derive the broad-spectrum co-focal distance and co-image plane equations, determine the focal distance difference and image plane difference fitness function, and establish the genetic algorithm structure parameter variation and material crossover method. In order to verify the feasibility and efficiency of the method, a visible and near-infrared broad-spectrum optical system is designed, and the system has an imaging band of 0.4–1.2 μm and a focal length of 40 mm. The difference in the focal length within the range of the band is less than 0.03 mm, and the imaging quality is good in the broad-spectrum range. The design results show that the genetic algorithm-based broad-spectrum optical system construction method can generate 1024 excellent populations at a time, of which 407 iterative individuals can meet the requirements of the objective function. The appropriate optimal solution is input into the Zemax software for optimization, and a broad-spectrum optical system that meets the requirements can be obtained very quickly. In summary, the proposed genetic algorithm can shorten the design cycle and improve the design efficiency of broad-spectrum optical systems.
Acta Optica Sinica
- Publication Date: Jan. 25, 2024
- Vol. 44, Issue 2, 0211003 (2024)
Topics
© Copyright 2018-2021 | Chinese Laser Press. All Rights Reserved 沪ICP备15018463号-20